


On the Edge
A new essay by Denis Wood

This essay is included, translated into Spanish, in Cartografías Críticas de las Periferias Urbanas (Editorial Tirant Lo Blanch, 2025). The book’s eleven papers concern themselves with urban peripheries, largely in Spain, though this essay is concerned with Raleigh, North Carolina, and another by Iconoclasistas with Coimbra, in Portugal. The perspectives taken vary, but all share a focus on the importance of making new maps to help shape a new world.
I lived on the edge of Cleveland when I was a kid, not three short blocks from the old bed of the Cuyahoga River, from Whiskey Island, from Lake Erie. After lights out, Chris and I would kneel beside the radiator and look out the window at the lights in the harbor, of boats moving into or out of the river, or blinking to tell them where to or where not to go. In a slow motion way, it was kind of exciting. We were living in Lakeview Terrace at the time, one of the oldest public housing projects in the country, among the very first to be built anywhere. That would have been in the mid-1930s. We moved in in the 1940s, onto Spruce Court. It had lots of kids and very few automobiles. Well, it was public housing.
Living on the edge was different. I mean, you had Lake Erie in front of you, stretching gray all the way to Canada, wherever that was, invisible in any case, a long way away. Unlike most of my classmates, who lived in Ohio City, I wasn’t surrounded by a sea of housing. For crying out loud there were huletts not two blocks away, unloading ore boats in the old bed of the Cuyahoga. There were more huletts on Whiskey Island. Their mournful growl was the soundtrack of my life. Closer to home we flattened pennies on the railroad tracks. There were still occasional steam engines, and when one chugged past Nancy would run around closing the windows against the smoke. This was life in a brick apartment building on the shores of a great lake in the seventh largest city in the US. This was life on the edge …
That wasn’t the only time I lived on the edge. Thirteen years later it was on the edge of Barranquitas, Puerto Rico, with Ingrid, who was teaching English at the Barranquitas Regional College of Interamerican University. It was just as different, but in another key. There were no huletts, no railroad tracks, no lake. Instead: the lowing of cattle, the singing of coquís, the mountains of the highlands. Barranquitas was a small town high in the middle of the island, an islet of white in a sea of green, a shoal really, down in its valley; and out at the edge of it they’d built this housing project. We lived across the street. So, again, few cars and lots of kids but out our back door … nothing for miles that wasn’t green. We could walk down to the Río Barranquitas and follow that down to La Santa, where, in the Cañón San Cristóbal, the Barranquitas ran into the Río Usabón (and even take that to La Plata and so to the Atlantic Ocean). Or we could hike overland to El Negrón, a canyon tributary to the San Cristóbal, less deep, less daunting, where in the end the Usabón plunged smoking down into the San Cristóbal. What a beautiful waterfall!
It was nothing to have a stray chicken stroll through the always open doorway, or a horse wander past the window. It was different here from being in town with houses on every side of you, especially from being in Calle Abajo, so close to your neighbors you could hear them breathing at night. Occasionally it had a lonely feel, yes, even with the projects just across the street, even then at night the crowing of a distant rooster could make the distance palpable and the silence pregnant with possibilities.
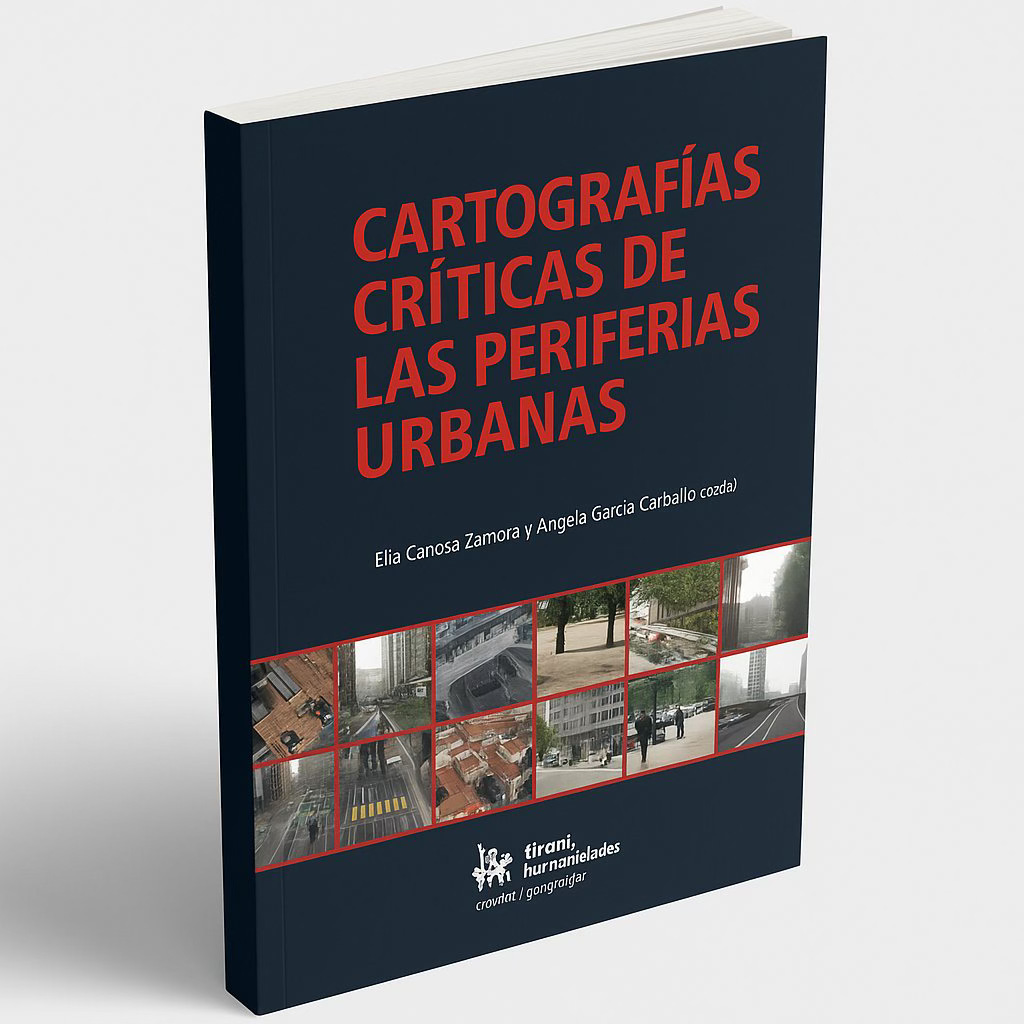
The last time I lived on the edge was in Boylan Heights, in Raleigh, North Carolina, where it was the neighborhood that was on the edge, and that in a very special way: it was more or less completely surrounded by largely inscrutable, if impossible to miss, state institutions (Fig. 1).1
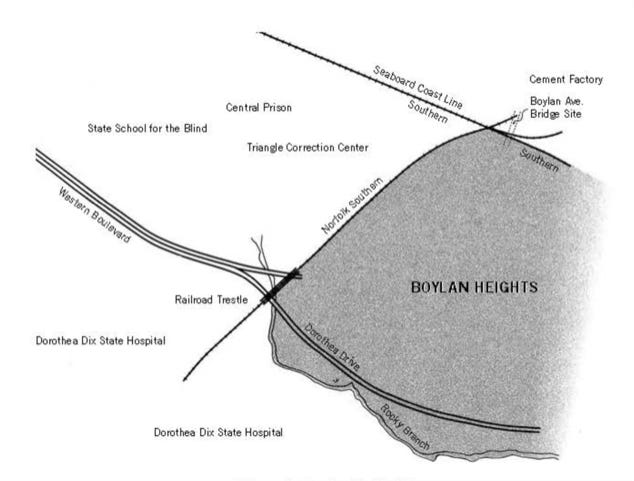
Central Prison, North Carolina’s maximum security prison for men, lay just to the west of the neighborhood. It was a classic 19th century prison – castellated, giant ashlars (construction dating to 1870) – and while some of the old walls still stood, Central was already beginning the expansion that continues today. Central has the state’s death row in it and better than a thousand inmates and, until 1994, it had a minimum security satellite, Triangle Correction Center, jammed in between it and the neighborhood. West of the prison was the state’s School for the Blind. This had been founded in 1845 and – … well, the western edge of Boylan Heights was sharply drawn, even without the Norfolk & Southern spur that on its way to Wilmington scooted between the neighborhood and the prison.
It was same to the south. There, until 2012, Dorothea Dix – the state’s central psychiatric hospital – spread its 2,300 acres up, across, and down the backside of Dix Hill. You could head south out of Boylan Heights, cross Dorothea Drive and Rocky Branch, and walk for miles on state land, because south of the hospital it was mostly experimental farms that belonged to the university. The tracks to the north of the neighborhood, the ones Boylan Avenue crosses, are nothing to sneeze at either. Southern’s and what was then the Seaboard Coastline’s (now CSX’s) main New York-Miami lines came together right below the bridge where they crossed the Norfolk & Southern tracks that ran to Wilmington. In a switch house beside the bridge an actual human used to manually threw those switches – pulling beautifully-tooled wooden handles – as Amtrak’s Silver Star and dozens of freights a day hurtled by.
No, only in the east was the question of the boundary open, and this probably only since Gas House Creek had been culverted along most of its length. On older maps it’s almost as hard an edge as Rocky Branch, and even when we moved in in 1974 the houses on the east side of the creek came from one world and those on the west – the neighborhood side – from another. But you had to pay attention to catch this … which of course was the point.
Another Way of Thinking
Well, that would have been one way of thinking about Boylan Heights, as a place in Raleigh, North Carolina, bounded by a prison and an insane asylum and some railroad tracks and a little creek. But there were other ways of thinking about it too. You could think about it as a neighborhood, for example, that is, as some sort of community, or a marriage of community and place, there, to be sure, but also those, those people, their relationships, their ways in the world, less a place than a process, a life process, a metabolic one. It would be interesting to think about that, what a neighborhood was, what a neighborhood did, how a neighborhood worked.
It would be interesting to think about Boylan Heights itself too, a particular, unique instantiation of a neighborhood, with its own unfolding, its own historical circumstances. No doubt the history of Boylan Heights could be embedded in a general history of neighborhoods, but it was also embedded in the history of Raleigh, of North Carolina, of the South, of the United States, and so it was unlikely to be the same as every other neighborhood. Its particular history would be interesting.
Among other things it would have to catch up the histories of the individuals out of whose life stories it was woven, my own for instance, for on taking up my position at North Carolina State in 1974, Boylan Heights was where Ingrid and I had landed. Talking to my dad a couple of days later I discovered that quite serendipitously Ingrid and I had moved into a neighborhood that my father and his family had lived in back in the early 1920s which meant – mirabile dictu! – that our sons would be the fourth generation of their family to live in Boylan Heights. I doubted anyone else could claim that. For a mapmaker like me who’d mapped everywhere he’d lived – Cleveland Heights, San Cristobal las Casas, Barranquitas, Worcester – this was an irresistible subject, and I envisioned a sequence of maps paralleling the movements of the Iroquoian-speaking Tuscaroras into the eastern Piedmont before being driven north to New York state in the early 18th century; the movements of my ancestors out of the Lower Palatinate and Anglo-Celtic highlands to Philadelphia, and so on down the Shenandoah and the Blue Ridge front into North Carolina; and the movements of the Africans shipped in shackles from the Maison des Esclaves on the Île de Gorée in Sénégal to the West Indies, thence north to Wilmington, and so up the Cape Fear River into the Piedmont. Boylan Heights: it was Tuscaroran, Anglo-German, African. All these peoples were in motion at the same time, into and out of what ultimately would become Boylan Heights where, of course, as the end point of one of these streams, I would end up living in a house constructed by African-Americans on land previously inhabited by Tuscarorans.
Yes, what a bunch of maps that would have been! And may still be someday, but … it wouldn’t have helped the landscape architecture students I’d been assigned to teach, me, a geographer with no knowledge whatsoever of landscape architecture. I say “teach” but really, since it was a studio class, “guide” or “mentor” might have been better. A typical studio master – yes, that’s the term of choice – would set his or her students something to design, a park perhaps, or a playground, a garden or a subdivision, and for a few weeks let them at it, wandering among the drafting tables offering “desk crits,” and finally a full crit, when the students would pin their work up to be commented on by the master and any others he or she might have invited in as … guest critics … and of course fellow students.
I knew how to do none of this.
I’d never been in a studio when I found myself running one, and desperate to somehow fill the yawning hours – half a day, three times a week – I thought about, what else? making maps. After all these kids were going to be shaping the land: why shouldn’t they know something about it? And what could be more helpful than mapping. The university was surrounded by neighborhoods so I sent the students out to map those. What I wanted was to use mapping as a way to selectively focus their attention on those aspects of the landscape that, in the instrumentality of their training as future professionals (at least they were open about it), they were apt to overlook: the way the land smelled, the way it felt in their legs when they walked it, the sound of the wind in the oaks after all the other leaves had fallen, the way twilight made all the difference. This at least was all useless knowledge – nothing a developer or a bank could monetize – and the maps were fun to make. And because landscape architecture students are design students, there was both an attention to polish and an imaginative drive to find the less “mappable” things that, from the beginning, set their work apart from that of cartography students who would be more concerned with “getting it right.” Even so, I couldn’t get them to leave the streets off their maps. As they mapped the nearby neighborhoods – Cameron Village, Cameron Park, Deveraux, Brooklyn Heights, Boylan Heights – the streets seemed to be the irreducible subject, the what-it-was that made neighborhoods neighborhoods. If you’re laying out subdivisions, as many of these students would end up doing professionally, streets really are all you have to play with, which is exactly why I was all the more eager to get rid of them. The streets seemed to inhibit the other qualities to which I was trying to draw their attention. The streets always emerged in the foreground no matter how far into the background you intended them to recede.
Then in 1982 – I’ve told this story so many times! – we were working on Boylan Heights, on a whole atlas of Boylan Heights, specifically on a map of street lights, and we began paring away the inessential, the map crap (the neat line, the scale, the north arrow), the neighborhood boundaries, the topography, finally the streets: first the scaled streets, then a schematic grid of the streets, and finally, even a hint of a grid of the streets. Daylight went too – that default daylight that most maps take for granted – so that we ended up fooling around with circles of white on a black background. This made it a map of lamp light, not lamp posts, and light was something we didn’t know how to deal with. Certainly, the uniform white circles we’d been drawing caught nothing of the way the light faded out at the edges, and one night, armed with a camera, we scaled a fence and climbed a radio tower on the edge of Boylan Heights hoping to catch the night lights on film. What a disappointment! The view from above was nothing like walking in and out of the pools of light dappled by the leaves of the trees. But I had a pochoir brush at home, and when Carter Crawford – who’d put himself in charge of atlas graphics – used it to draw the circles, it was magical (Fig. 2).2 That was the way it felt to be walking the streets at night!

Nothing but blotches of white. The usual “efficient” map would have located everything on the street onto a single sheet – that is, different marks for lamp posts, fire hydrants, street signs, trees. Our inefficient map concentrated on a single subject so that rather than the lamp posts, it brought the pools of light into view. No legend, no north arrow, no neat line, none of the usual apparatus. At last, a modernist feel! Maybe even a sense of poetry, something imagistic, a little like Pound’s “The apparition of these faces in the crowd:/Petals on a wet, black bough;”3 or Williams’s red wheelbarrow,4 but as it might manifest on a map, a map attentive to the experience of place. That’s when I realized we could write poems in maps, and I began thinking seriously about a poetics of cartography.
Maps as Poems
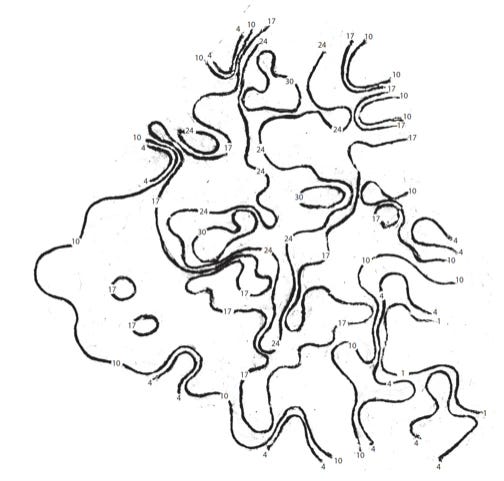
Why not? There was no law dictating what you could or couldn’t map. Or how you had to map it. There was no law about mapping at all. So we could map other things. We could map anything we wanted. And if we did want to map the streets, we realized we also wanted to map what was under them, the sewers, the water mains, the gas lines. And if we wanted to map the electric power lines, the cable vision lines, and the phone lines, we also wanted to map the squirrels that used them as highways. We never managed the squirrels – no zoologist in the class – but we did manage to map the streets, the sewers, the water mains, the gas lines, the electric power lines, the cable vision lines, the phone lines and … the sound of the wind chimes in the neighborhood (Fig. 3).5 Yes, it seems obvious once you think about it, but sounds are an aspect of place. And so are smells, even tastes; though, while we talked about tasting the neighborhood, you know, putting our tongues on trees and house siding and sidewalks, we ended up not doing it. And, okay, actually I did put my tongue on a bunch of siding and sidewalks and a few trees, but I couldn’t figure out how to make a map of it. It was like the textures we collected by laying down a sheet of tracing paper and rubbing it with a stick of graphite …

It was … too all-over-the-place. For a plate in the second edition of the atlas that was finally published we chose rubbings of words, like the word “WATER” that appeared on water meter covers, or the “BELLSYSTEM” that showed up on tags fastened to power poles, or the names (“A. N. HOLDING”) stamped into sidewalks by the guys who poured the concrete; and then just arranged these in a grid to suggest the bewildering variety of neighborhood words without committing ourselves to their spatial distribution (Fig. 4).6

There was just so much stuff to map! The locations of barking dogs. The colors of the leaves in autumn (Fig. 5).7 The graffiti traced in the sidewalks. The fences. Assessed property values. The route of the mailman through the neighborhood. The route of Lester’s paper route (Fig. 6).8 Street signs. Trees disfigured by utility companies. The stars that shined overhead at night. The topography (Boylan Heights was laid out on a hill). Trees in general. The carved pumpkins put out on porches at Halloween. To make this I rode through the neighborhood on my bicycle on Halloween – it was 1982 – and took photos of all the jack-o’-lanterns. I printed these out as contact sheets, and cut out the little pumpkins which I pasted down on the addresses of the porches where I’d found them: Halloween in Boylan Heights (Fig. 7).9


But it wasn’t just making maps of novel subjects that was exciting; it was making maps in novel ways. When I’d studied cartography in graduate school I’d had to buy a set of mapmaking tools, i.e., drafting tools: bow compasses, dividers, ruling pens, Rapidograph pens; bottles of India ink; sheets of vellum; and we worked at drafting tables equipped with drafting machines, triangles, T-squares, and architects scales. But we also had to learn FORTRAN because we were moving the whole mapmaking operation onto computers, and nowadays that’s how it’s done, with ArcGIS or one of its clones, online, though without the barrier of a programming language. Here we had none of these things, neither the drafting equipment nor the computers. It was 1982. We had our wits.
To make this map of the neighborhood’s assessed property values (Fig. 8) we used the values Wake County had assigned for tax purposes, writing the values over the homes on a map of Boylan Heights. I smoothed the values of these 333 residential lots across a 281-cell grid and then interpolated contours across the grid. Now what? I glued strings to the contour lines and made a rubbing of the strings. The values are thousands of dollars and you can see a spine of high values running down the center of the map, with the values falling off as you slip down hill. This, in fact, embodies the plan of the original developers of the neighborhood, the highest value lots having been laid out at the top of the hill around the old Boylan plantation mansion which still stood though, when we were working, functioning as a church; the value of the lots declining as you moved away from this center, and downhill, and decreasing in size as well. The lowest value properties ran along the neighborhood’s peripheries, the very lowest in the southeast where the neighborhood’s weakest edge lay, where Gas House Creek itself was culverted, and the neighborhood bled into the rest of the city …
Map after map was made this way, oh, not by rubbing strings, but crazily, with pochoir brushes, with miniature versions of traffic signs, with numbers, with words, with cartoon figures and, yes, with graduated circles and graduated lines and computer symbology but also with stars appropriated from Galileo Galilei. Why? Because we were singing a poem about Boylan Heights at the top of our voices … in maps! It was a narrative poem, a poem that didn’t just celebrate a moment or a feeling but that told a story, a story about life in a city, about life in a neighborhood, about life in Boylan Heights. It was a story about how Boylan Heights took a bunch of generic, stuff – streets, street signs, manhole covers, men, women, children – and turned them into that manhole cover there (Fig. 9), with its unique pattern of wear, on Cutler Street,10 which Lester rode his bike over (Fig. 6) as he delivered his paper route, tossingthe paper to each of his customers (Fig. 10).11 And so the atlas was arranged with the most generic neighborhood things up front, followed by maps tracing the transformation of those things into the uniquenesses that were Boylan Heights; the hill, the street, and the residences into the sounds of those windchimes, the barking of those dogs, the colors of those leaves. The maps tracked a process, one unfolding in time. They told a story.


And maybe it was because it was a story about life on the edge that the maps were so often on the edge too. Or maybe that had nothing to do with it. But the maps were out there, and not just in their form. The maps were committed. Ira Glass wrote this:
These maps remind me of all the radio stories I love most. After all, radio is mostly a boring salary-man, waking up before you and me to announce the headlines or play the hits to some predetermined demographic. Yet some radio stories elbow their way into the world in defiance of that unrelentingly practical mission, with the same goal Denis Wood’s maps have: to take a form that’s not intended for feeling or mystery and make it breathe with human life.12
And this:
That a cartographer could set out on a mission that’s so emotional, so personal, so idiosyncratic, was news to me.13
Actually, it was news to me too. I still have no idea where these maps came from, but I’m pretty sure that there can be little doubt that it was because they were, just like the neighborhood, out there on the edge.
Denis Wood, Everything Sings: Maps for a Narrative Atlas, Siglio Press, Los Angeles, 2010, p. 16.
Ibid., p. 47.
Ezra Pound, “In a Station of the Metro,” Poetry 2(1), April 1913, p. 12.
William Carlos Williams, “The Red Wheelbarrow,” Spring and All, XXII, Contact Editions, New York, 1923.
Wood, Everything Sings, p. 91
Denis Wood, Everything Sings: Maps for a Narrative Atlas, Second Edition, Revised & Expanded, Siglio Press, Los Angeles, 2013, p. 105.
Ibid., p. 121.
Ibid., p. 67
Ibid., p. 91.
This is a rubbing of a manhole in the 600-block of Cutler Street which, while widely exhibited, has never been published before. It was rubbed in 1982.
Wood, Everything Sings Second Edition, op. cit., p, 68.
Ira Glass, “Introduction,” to Wood, Everything Sings Second Edition, op. cit., p, 11.
Ibid. p. 10.