One of the most popular posts on the old Makingmaps.net blog, with almost 84,000 views (since first published on April 3, 2008), features Erwin Raisz’s typology of landforms and mattching terrain symbols illustrated in his indubitable style.
The post and the illustrations from a 1931 publication (Geographical Review, vol. 21, no. 2, April 1931) spread around (Reddit, Pinterest, various discussion forums, baby Twitter, etc.). The specific landforms and hand-drawn pictorial terrain symbols struck a chord with the hand-drawn fantasy, war-gaming, role-playing, and art map makers who were starting to pop up all over the place at the time. Obviously, seeing the method behind Raisz’s maps also appealed to all kinds of map aficionados.
This positive response to a seriously retro approach to making maps was partly driven by the sameness of most software-created maps,1 especially for those looking for maps that were more human and less machine. Raisz’s typology and examples also showed how to translate particular kinds of terrain into specific map symbols that anyone with a bit of practice could create. Maybe with software (probably not GIS software), but certainly with a pen on paper. At the time, such interest in a terrain mapping method that was (at the time) difficult (if not impossible) to create with GIS software was heartening. GIS is powerful and impactful, but what kind of maps we make should not be limited to only what the software can do (however substantial that is).
Below, find the original text and illustrations of Map Symbols: Landforms & Terrain from Makingmaps.net, April 3, 2008.
Why not pull out some nice paper, a few pens of varying widths, and draw yourself up some terrain by hand?
Erwin Raisz is among the most creative cartographers of the 20th century, known in particular for his maps of landforms.
In 1931 Raisz outlined and illustrated the methods behind his landform maps, in an article in the Geographical Review (Vol. 21, No. 2, April 1931). Excerpts from the text and graphics in the article are included below.
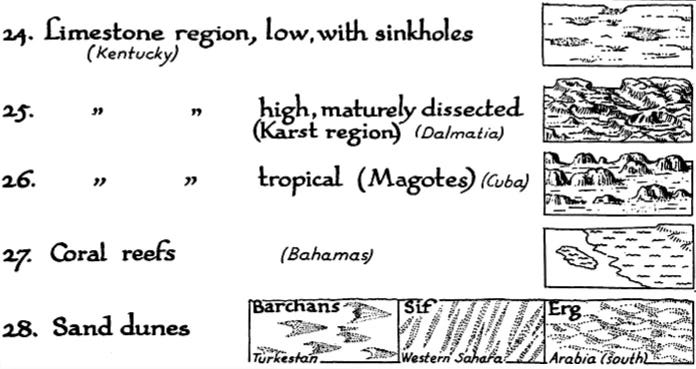
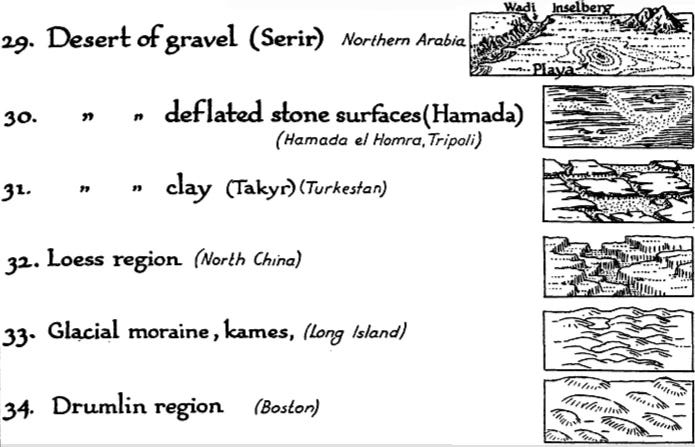
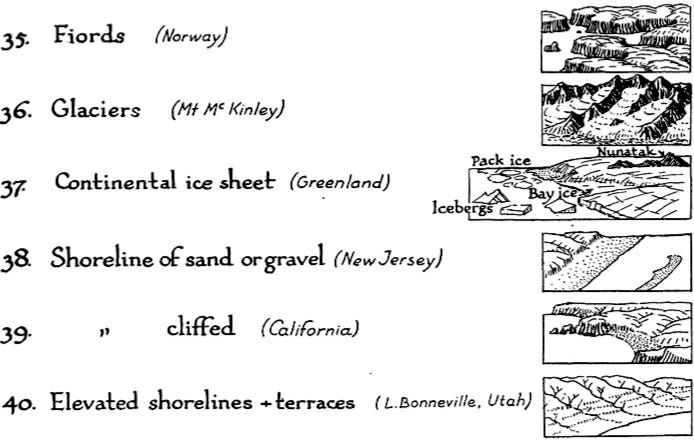
Raisz’s approach is to create complex pictorial map symbols for specific landform types. Each specific application, of course, would have to modify the symbols to fit the configuration of particular landforms.
One of the limitations of Raisz’s work is that it is so personal and idiosyncratic that it virtually defies automation or application in the realm of computer mapping. Thus digital cartography has, in some cases, limited the kind of maps we can produce.
Raisz writes:
There is one problem in cartography which has not yet been solved: the depiction of the scenery of large areas on small-scale maps.
Most of our school maps show contour lines with or without color tints. Excellent as this method is on detailed topographic sheets … it fails when it has to be generalized for a small-scale map of a large area. Nor does the other common method, hachuring, serve better.
For the study of settlement, land utilization, or any other aspect of man’s occupation of the earth it is more important to have information about the ruggedness, trend, and character of mountains, ridges, plains, plateaus, canyons, and so on-in a word, the physiography of the region.
Our purpose here is to describe and define more closely a method already, in use, what we may call the physiographic method of showing scenery. This method is an outgrowth of the block diagram. [T]he method was fully developed by William Morris Davis. Professor Davis has used block diagrams more to illustrate physiographic principles than to represent actual scenery.
Professor A. K. Lobeck’s Physiographic Diagram of the United Statesand the one of Europe do away entirely with the block form, and the physiographic symbols are systematically applied to the vertical map. His book Block Diagrams is the most extended treatise on the subject.
It is probable that the mathematically-minded cartographer will abhor this method. It goes back to the primitive conceptions of the early maps, showing mountains obliquely on a map where everything should be seen vertically. We cannot measure off elevation or the angle of slope. Nevertheless, this method is based on as firm a scientific principle as a contour or hachure map: the underlying science is not mathematics but physiography.
If we regard the physiographic map as a systematic application of a set of symbols instead of a bird’s-eye view of a region, we do not violate cartographic principles even though the symbols are derived from oblique views instead of vertical views. It may be observed that our present swamp symbols are derived from a side view of water plants.
••••••
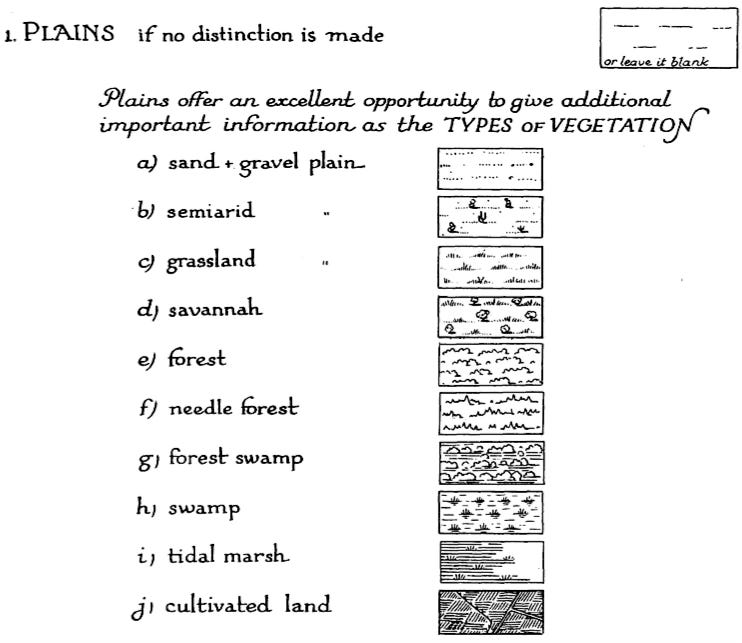
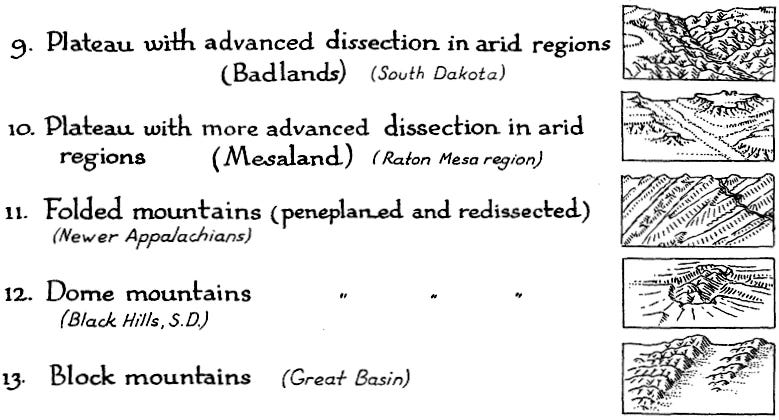
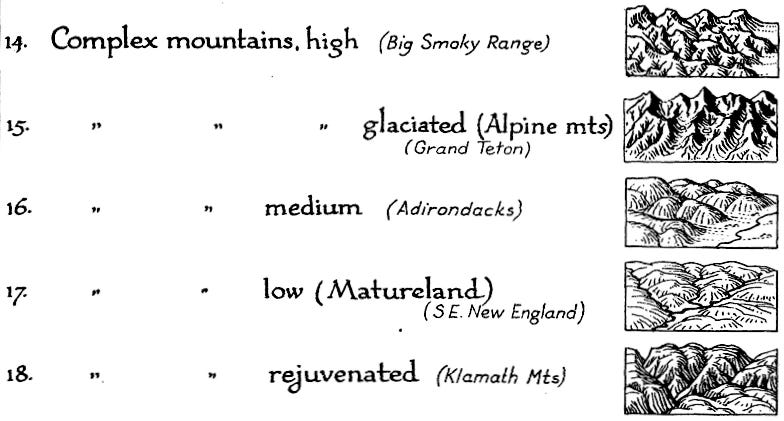
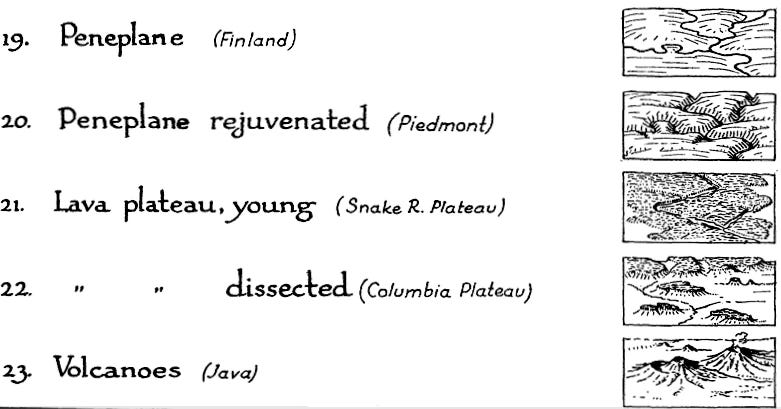
Landform map symbols include: plains (sand & gravel, semiarid, grassland, savannah, forest, needle forest, forest swamp, swamp, tidal marsh, cultivated land), coastal plain, flood plain, alluvial fans, conoplain, cuesta land, plateau (subdued, young, dissected), folded mountains, dome mountains, block mountains, complex mountains (high, glaciated, medium, low, rejuvenated), peneplane, lava plateau (young, dissected), volcanoes, limestone region (with sinkholes, dissected, karst, tropical, mogotes), coral reefs, sand dunes, desert of gravel (serir), deflated stone surfaces (hamada), clay (takyr), loess region, glacial moraine, kames, drumlin region, fjords, glaciers, shoreline (sand, gravel, cliffed), and elevated shorelines & terraces.
The relationship between software options and the look of maps would be an interesting study. Back in the early days of computer mapping, a whole bunch of different mapping software emerged: Symap, MapInfo, AtlasGIS, Surfer, Calfform, and so on. The options seemed to diminish as a few software options dominated. However, there seems to be a new growth in options in the last decade. How was map design implemented in all these different software options over time?




D&D (Dungeons and Dragons) and other RPGs (role-playing games) got me into cartography as a kid in the late 1970s and early 1980s. Now my mapping takes two forms: [1] census mapping for research and teaching; and [2] world-building and dungeon mapping for role-playing games with my friends. Sadly (?), the two rarely cross.
I usually use QGIS (though before the pandemic I used ESRI products) and MS-Excel (for cleaning .csv files) for the first. Very rarely I have used R in this capacity. While there is something that feels very precise and systematic about these kinds of maps, they lack the personality of my maps for RPG games. My RPG maps are almost always hand-drawn, sometimes on hex paper (especially the kind used in organic chemistry, which has much larger hexes than the older hobbyist hex paper), sometimes graph paper and sometimes lineless paper. Since the pandemic in 2020, my local RPG group has taken to using Discord and Owlbear Rodeo for playing online, as one of our number has a compromised immune system. In those cases, I usually scan my maps and then upload them to Discord or Owlbear Rodeo. I'm particularly pleased with my few isometric maps.
I'm able to use many of the techniques I developed as a kid and gamer in making my RPG maps. Sadly, these don't come through in my work maps; I had to learn formal cartographic techniques once I became a tenure-track professor, as I always took statistics courses through my degrees when I could have taken a cartography or GIS course (even though all my degrees are in Geography). I regret my lack of formal cartographic training, though our map librarian has hammered me into a serviceable one when it comes to map composition and the like; they also taught me how to use GIS.
Here is the crux of why I am posting: Many of the landform illustrations you show above are akin to those that captured (and still capture) my geographical imagination (in the literal sense, as the places I imagine are often only in my mind until I map them). In particular, the Molday version of Basic or Expert D&D (ca. 1980) made use of map symbols that must have been influenced by Raiitz's symbology. Thank you for providing these citations. As a kid and since then, I've noted the various cartographic styles or genres I see in RPG maps. Products by Chaosium (e.g., Runequest, Call of Cthulhu) drew on symbology that often incorporated elevation lines or hatched hill lines. Judges (sic) Guild products incorporated the stencilled (?) trees of yore. TSR (and later Wizards of the Coast) tended to incorporate simpler maps, but not always, and they championed isometric cut-away view maps. In this century, Goodman Games has continued using isometric maps and top down dungeon maps that appear to be hand drawn, though were probably also modified in a graphics program. I could go on. Hmm. Maybe I could write a paper about the evolution of mapping conventions and genres in RPG games, assuming nobody else has done that.
Anyway, thanks for the post. It was a lovely break from answering email about marking guides.
Best Regards,
Jeff